How to Create Pie Chart in HTML?

Hello Coders, In this blog post, You will learn to create a pie chart in HTML. Creating a pie chart is very easy in HTML if you use the correct code or method for it. The pie chart is used to show data in a single pie with percentages to make it easier and more understandable for the user.  Let us learn about it in detail:- 
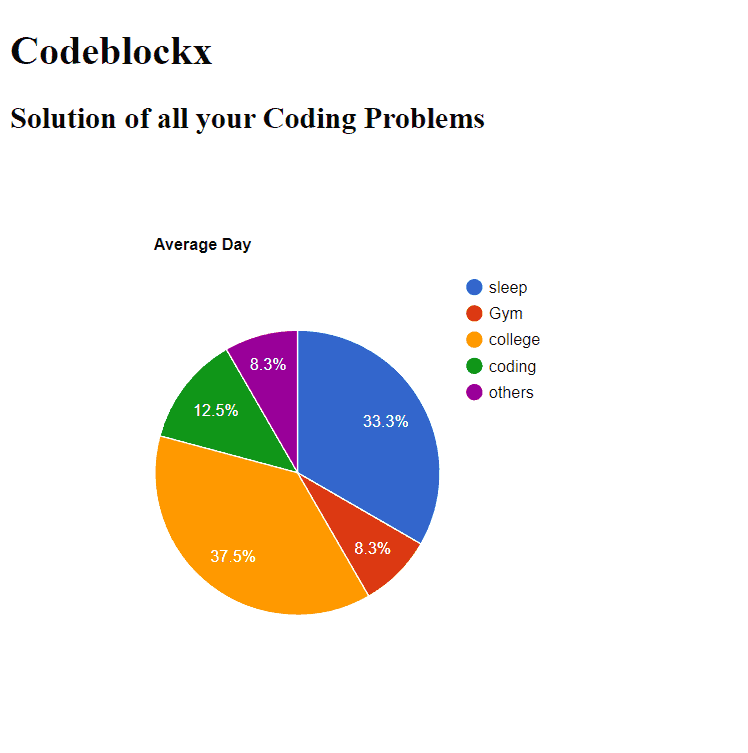
pie chart

To add this pie chart in html we will use the chart API at google. To use that API we will use this (<script type = “text/javascript” src = “https://www.gstatic.com/charts/loader.js” > </script> ) line of code in the file.


After this, we will use one more script tag in which we will define the full pie chart. We will add all the values in the pie chart and decide its height, width, and title. Adding height and width is optional. After adding all this we will redirect the pie chart to the div tag and will close the script and body tag. 

The Full Code and Output to add Pie Chart in HTML is:-

Index.html

<!DOCTYPE html>
<html>
    <body>
        <h1> Codeblockx </h1>
        <h2> Solution of all your Coding Problems </h2>
        <divid = “pichart”>


        </div>


        <script type = “text/javascript” src = “https://www.gstatic.com/charts/loader.js” >


        </script>


        <script type = “text/javascript” >
            google.charts.load(‘current’, {‘packages’:[‘corechart’]});
            google.charts.setOnLoadCallback(drawChart);
            function drawChart()
            {
              var data = google.visualization.arrayToDataTable (
                [
                    [‘Task’ , ‘Hours per Day’],
                    [‘sleep’ , 8],
                    [‘Gym’ , 2],
                    [‘college’ , 9],
                    [‘coding’ , 3],
                    [‘others’ , 2]
                ]);
                var options = {‘title’ : ‘Average Day’, ‘width’ : 600, ‘height’ : 500};
                var chart = new google.visualization.PieChart(document.getElementById(‘pichart’));
                chart.draw(data , options);
            }
            </script>
    </body>
</html>

OUTPUT

pie chart in html

Hope this blog was helpful to you and you have found the answer to your question. Check out our blog post to find more answers to your question. If you have any doubts about any coding questions then let us know in the comments section. We will answer it as soon as possible. 

Leave a Comment

Your email address will not be published. Required fields are marked *