How to create Bar Chart in HTML?

Hello Coders, In this blog post, You will learn to add a Bar chart in HTML. A bar chart is a chart that represents data with a rectangular bar. We will make two types of bar charts one is a vertical bar chart and the other is a horizontal bar chart. Let us learn about them in detail:-

Bar chart in html

To make this line graph in Html we will use a charting library named plotly.js in JavaScript. This Library comes with 40 chart types, 3D charts, Statistical graphs, and SVG Maps. This Graphs Code Consists Const data which is used to define data, Const layout is used to define the layout of the graph, and plotly.newplot is used to show the graph. The code and Output for these charts are:-

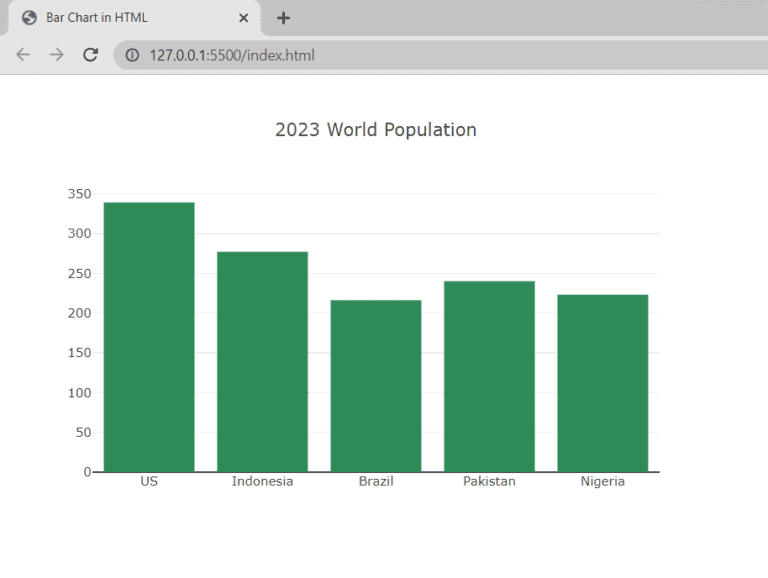
1. Vertical Bar Chart

Index.html
<!DOCTYPE html>
<html>
    <head>
        <title> Bar Chart in HTML </title>
    </head>
    <script src= “https://cdn.plot.ly/plotly-latest.min.js”> </script>
    <body>
        <div id= “myPlot” style= “width:100%;max-width:700px”> </div>
        <script>
            const xArray = [“US”, “Indonesia”, “Brazil”, “Pakistan”, “Nigeria”];
            const yArray = [339, 277, 216, 240, 223];
            const data = [{
                x:xArray,
                y:yArray,
                type:”bar”,
                orientation:”v”,
                marker: {color:”seagreen”}
            }];
            const layout = {title:”2023 World Population”};
            Plotly.newPlot(“myPlot”, data, layout);
        </script>
    </body>
</html>
OUTPUT
Vertical bar chart

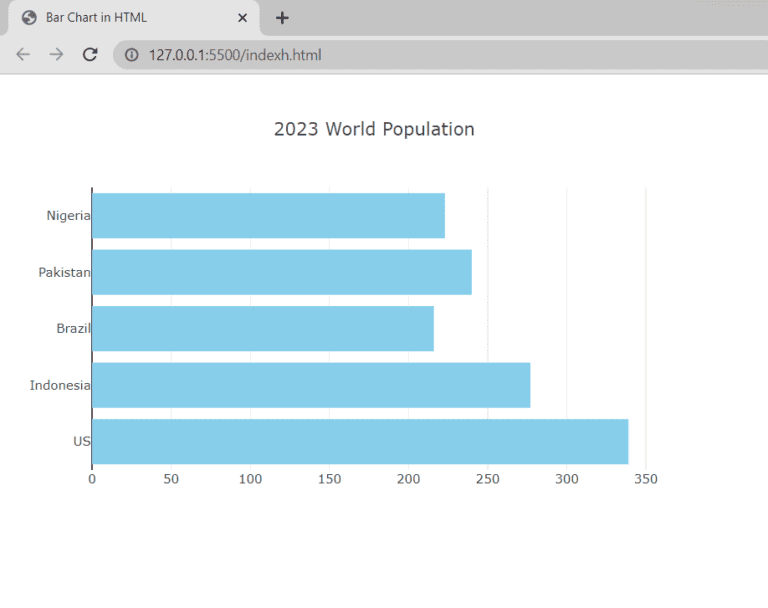
2. Horizontal Bar Chart

Index.html
<!DOCTYPE html>
<html>
    <head>
        <title> Bar Chart in HTML </title>
    </head>
    <script src=”https://cdn.plot.ly/plotly-latest.min.js”> </script>
    <body>
        <div id= “myPlot” style= “width:100%;max-width:700px”> </div>
        <script>
            const xArray = [339, 277, 216, 240, 223];
            const yArray = [“US”, “Indonesia”, “Brazil”, “Pakistan”, “Nigeria”];
            const data = [{
                x:xArray,
                y:yArray,
                type:”bar”,
                orientation:”h”,
                marker: {color:”Skyblue”}
            }];
            const layout = {title:”2023 World Population”};
            Plotly.newPlot(“myPlot”, data, layout);
        </script>
    </body>
</html>
OUTPUT
Horizontal Bar Chart

We hope you got the answer to your question. As you are now learned about Bar charts you should now learn about Creating a line graph in html. As both the topics are related Check it out we have a detailed blog post on it and it will be helpful to you.


Thank you for visiting our blog. If you have any doubts about any coding questions then let us know in the comments section we will answer them as soon as possible. Till then check out more posts and find answers to more amazing questions.

3 thoughts on “How to create Bar Chart in HTML?”

Leave a Comment

Your email address will not be published. Required fields are marked *